As my previous projects show, I'm quite interested in fantasy football. The prospect of participating in long term contests and drafting plenty of
is very enticing to me. As such, I have delved deep into the Underdog Fantasy streets. Underdog posts data from their flagship NFL contest each year.
Accordingly I've spent considerable time theory crafting strategies and analyzing past years data behind these ideas. Recently, I've appeared on Peter
Overzet's Best Ball Breakfast and Establish The Run's Establish The Edge shows.
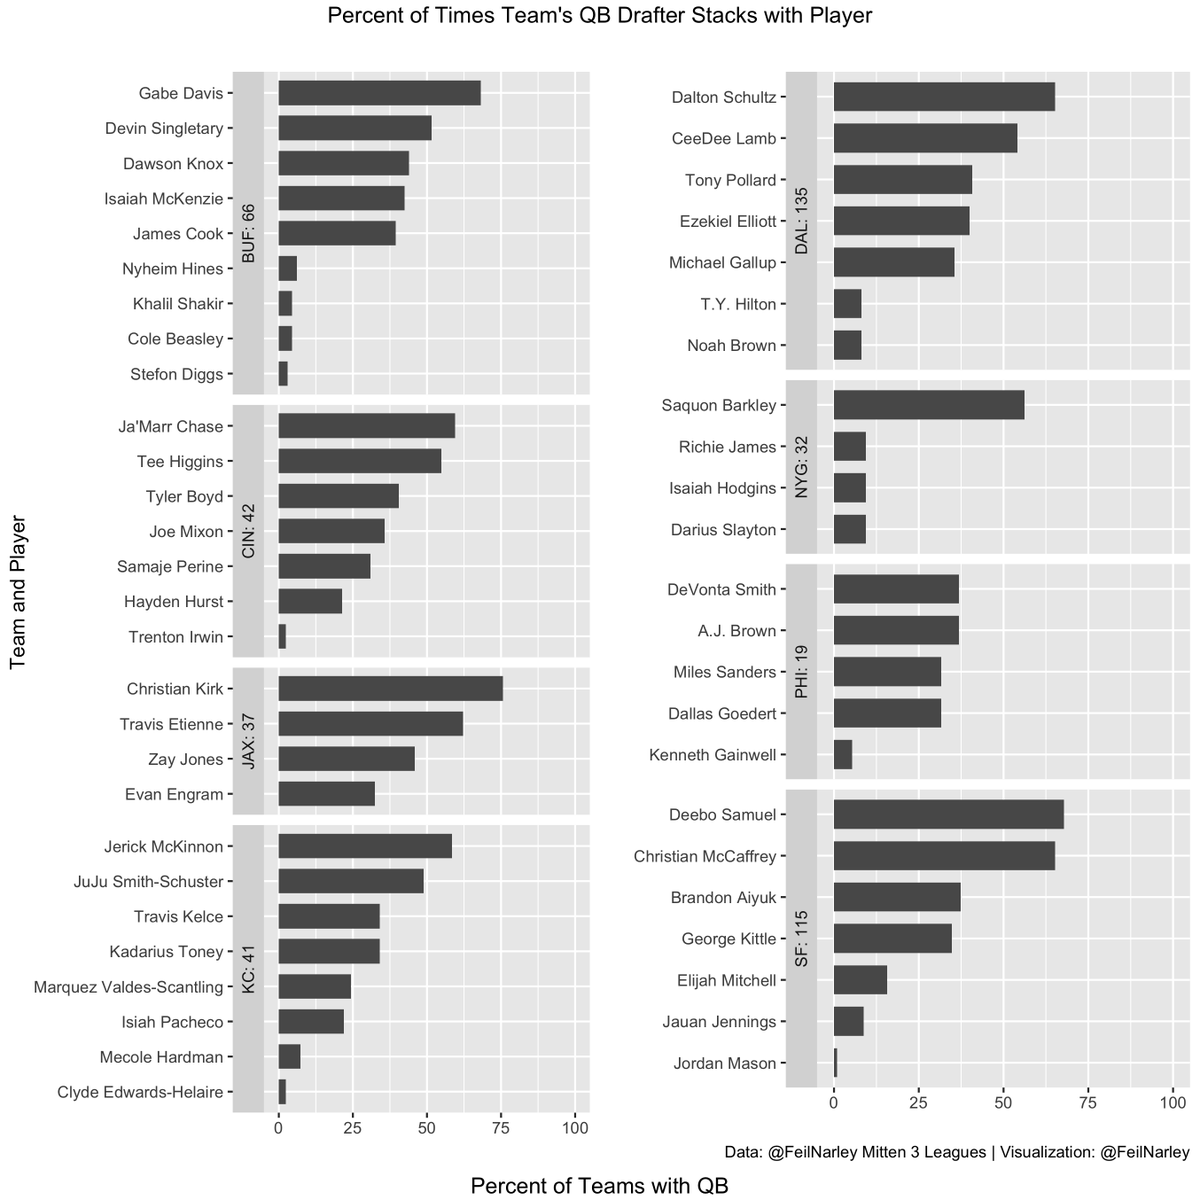
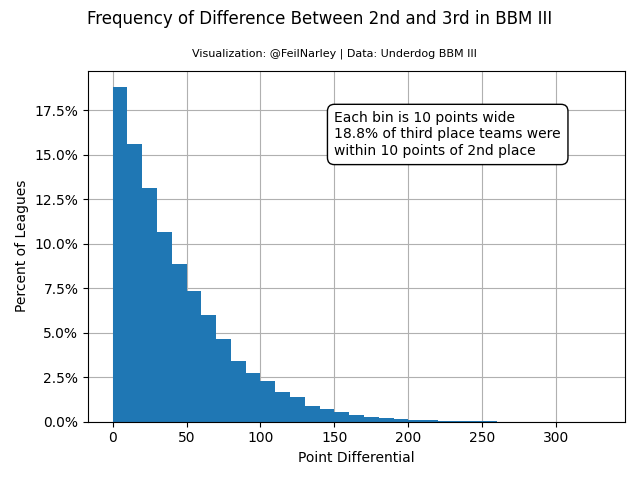
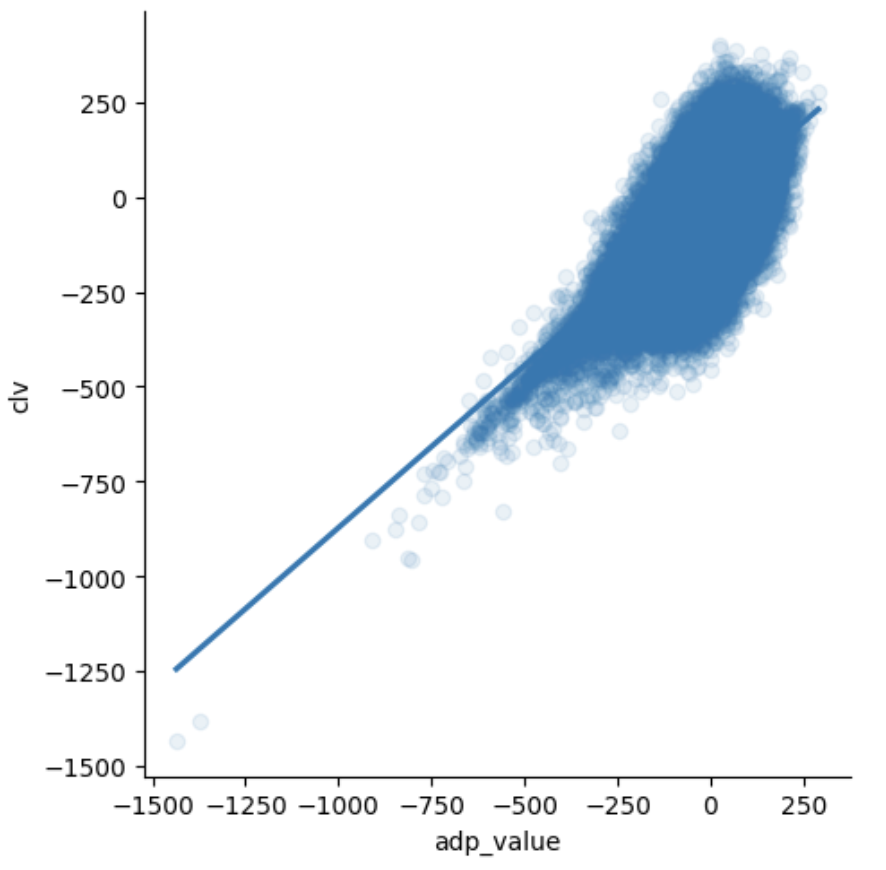
Most of my publically available work is posted to my twitter, twitter.com/FeilNarley. These data dives include looking at the importance of overlapping
bye weeks, visualizing stack tendencies in my playoff drafts and confirming the impact of ADP value. In the past, I did not mind differentiation
through overlapping bye weeks, but advance rates plummet when byes overlap. This, intuitively, is true at quarterbaack and tight end, but is also the
case at wide receiver and running back. Weighing this against value of stacking complecates my analysis to this point.
My intent through twitter threads is to breakdown dynamics in the best ball space and supply a concise takeaway. Occassionally, I will post charts or
exploratory analysis that I did not think was worth greater investigation at the time. Understanding the landscape and the data is necessary to avoid
common pitfalls of working with small data. There may be hundreds of thousands of rows, but the takeaways are often quite biased to isolate season-long
or one week outcomes during the NFL season. Even without being intimently familiar wtih players you can succeed by putting yourself in position to
capitalize and respecting the market, though it may not be perfectly.
If you are interested in best ball, NFL analysis or data visualization, please reach out to me. I am always happy to help others out with
troubleshooting or exploring new areas. I'd be happy to share most of my code, but it is not on my github.
Links to threads: ADP Value Overtime, Picking from Top of Queue, Importance of Bye Weeks, Stack Percentages, Visualizing Playoff Draft Tendencies, Golf Finals Preview
Link to podcasts: ETE, BBB
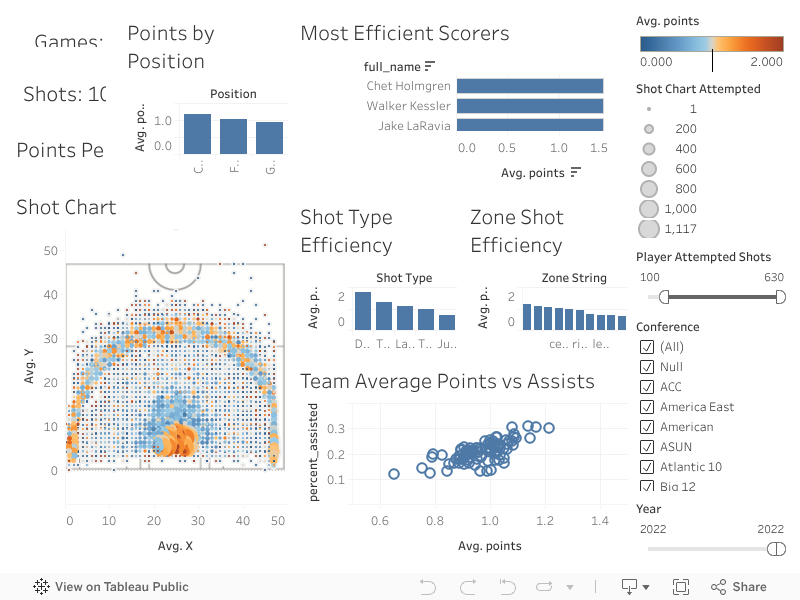
While I was never excelled at playing basketball, it has long been one of my favorite sports to watch because of its fast-paced
physical nature. A couple of summers ago I read Kirk Goldsberry’s book Sprawlball, the visualizations and analysis were extremely
inviting. Such a simple idea as charting basketball shots has revolutionalized the way basketball is played. Three pointers and
shots at the basket are far more prevalent now than in the past. Shotquality.com tracks this for each NBA and NCAA Division I team.
Inspired by Shotquality.com and Sprawlball, I wanted to gather as much basketball data as I could. There are packages you can use to
retrieve data from ESPN, but not all of the data I was interested in. For example, the R package, ncaahoopsR, does not allow you to
get pre-game spreads and totals. I also wanted to bring these ideas and capabilities to python, the coding language I prefer to work
in. Consequently, I developed code to scrape play-by-play, box score, betting lines and more all within python.
Once obtaining the data for the 2021-22 season, I went out to create a dashboard looking at shot efficiency, for chartable shots.
Most games do not have shot charts, unfortunately. The dashboard below is the results of this scraping and Tableau. One of my
primary side projects at the moment is looking into other types of analysis on this data. For example, making a in-game win
probability model among exploring other questions. Much of the code can found on my GitHub.
The dashboard below is interactive. Hovering some charts will highlight on others and clicking can be used to filter.
As an avid fantasy football player, I have experienced my fair share of incredibly unlucky and frustrating football weeks. I think one common
experience for every fantasy football player is fantasizing about what could have been if you only played Johnny week 3 and Blake week 7 then
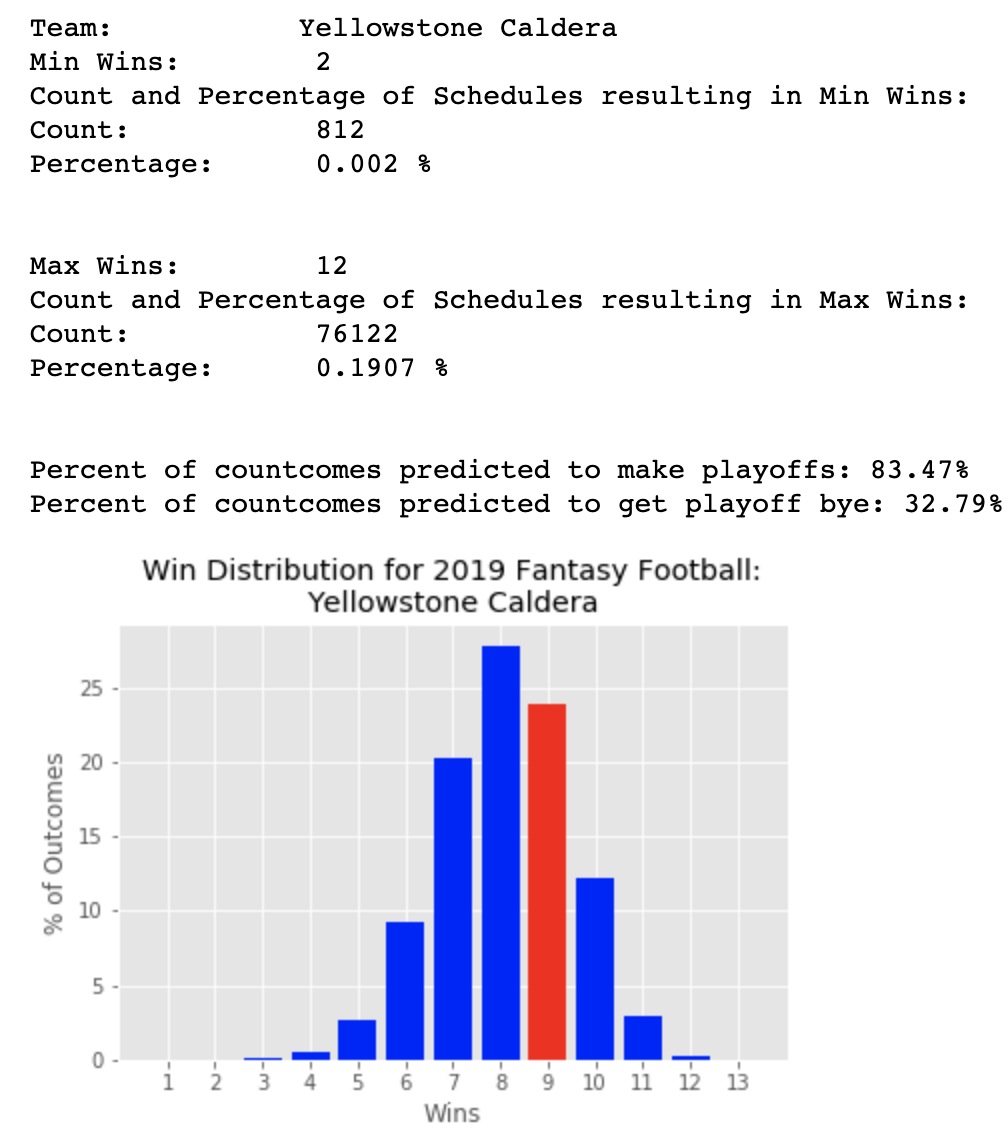
you would have two more wins! An incredible string of unluckiness in one of my leagues lead me to wonder what a distribution of wins based on
different schedules would look like for my team. An enormous amount of analysis goes into seeing what could happen with every player and team
in the future, but seldom do people seriously analyze their luck and past decisions over the long run.
Seeing as I wanted to learn about web scraping for a considerable amount of time, it only seemed appropriate for me to kill two birds with one
stone. I picked up knowledge about using APIs, selenium web driver, and beautifulsoup in my quest to acquire the data. After getting data about
weekly performance, I could make every iteration of the schedule using a custom Python function. This allowed me to visualize the distribution
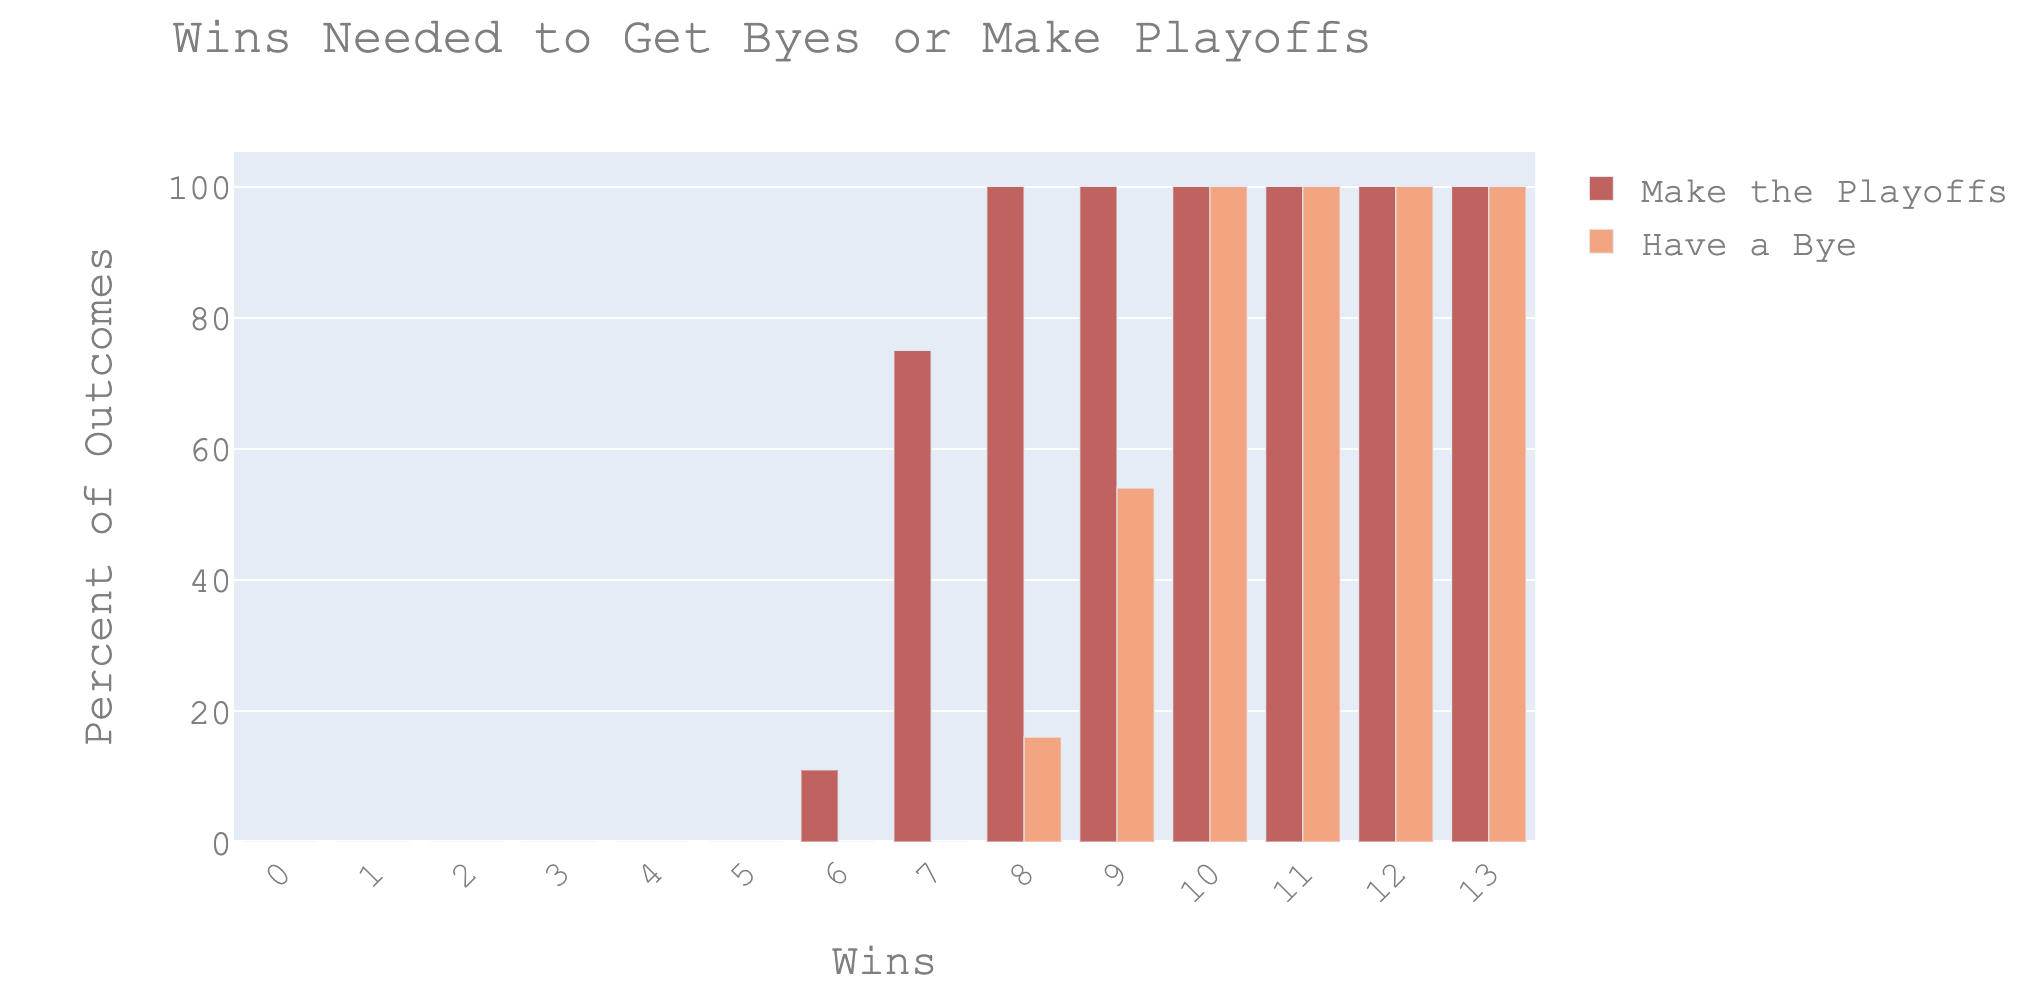
of wins based on the line-ups set and schedule. Using a random number generator to access public leagues, I also made a distribution of wins
necessary to get a bye and make the playoffs. This allowed me to make estimations about how often I would make the playoffs or get a bye.
Additionally, using fantasy football expert consensus rankings and bench points, I looked at how recommended lineups compared to my chosen lineups.
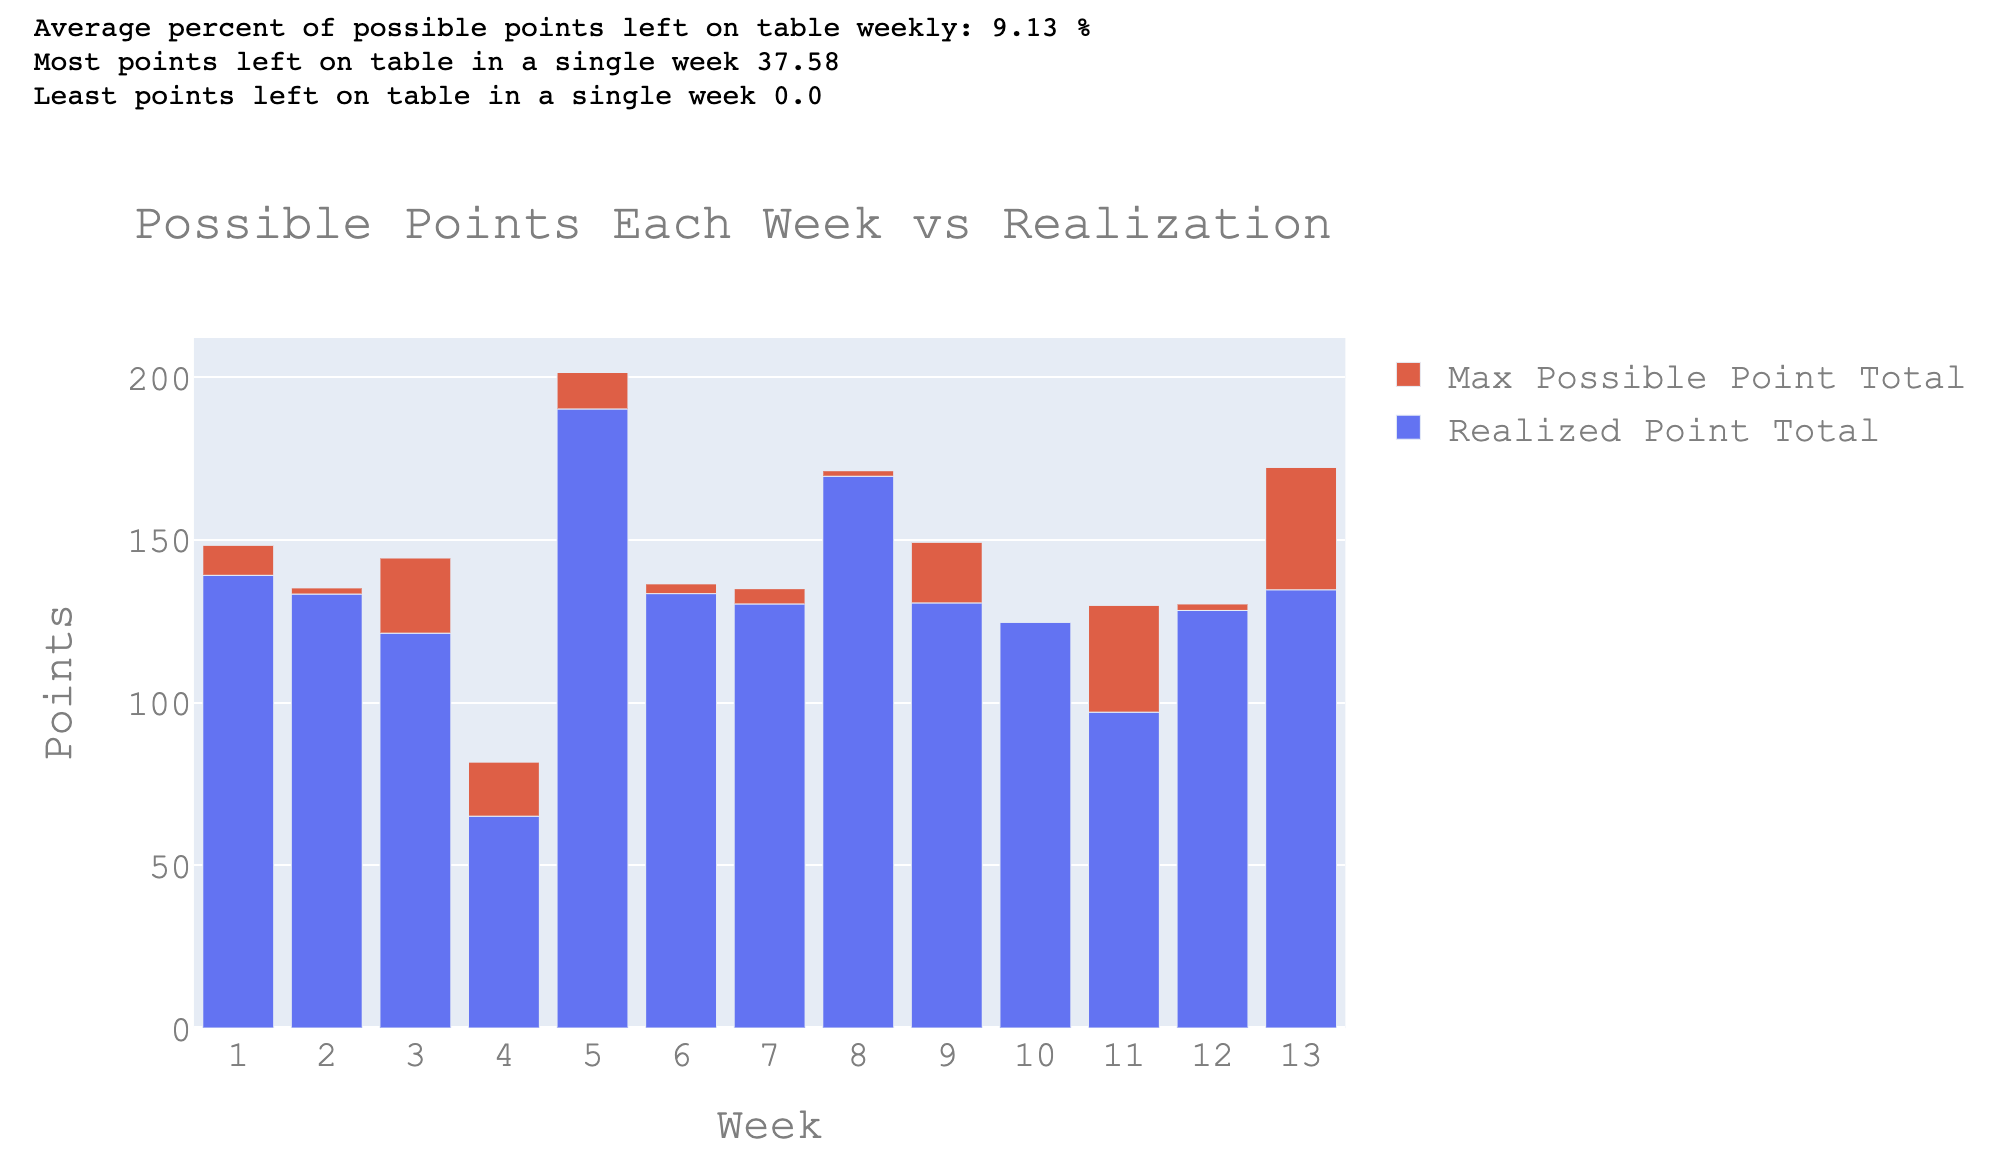
Also, using data from bench spots every week, I looked at how many points I left on the table compared to optimal lineups and how those would have
performed. While I did not do it at the time, I would like to make a CDF of points for my league to look at approximate win odds based on expected
points or actualized points. I wrote a longer report about this with visuals on
LinkedIn, and much of my code is available
on my my GitHub.
Recently, I wanted to learn new algorithms. During my search, I came across the Backtracking Algorithm. The algorithm itself offers some
interesting uses as it tries to solve using the current format recursively till an issue arises. In which case the algorithm backtracks to
the point where it can try a new solution.
The classical example of the backtracking algorithm is the
N-Queens problem. This requires the placement of N-Queens on a NxN
board so no queens have another queen horizontal, vertical or diagonal from it. After developing a program that correctly could return a valid
response and print the solution for the N-Queens problem, I wanted a more consuming project.
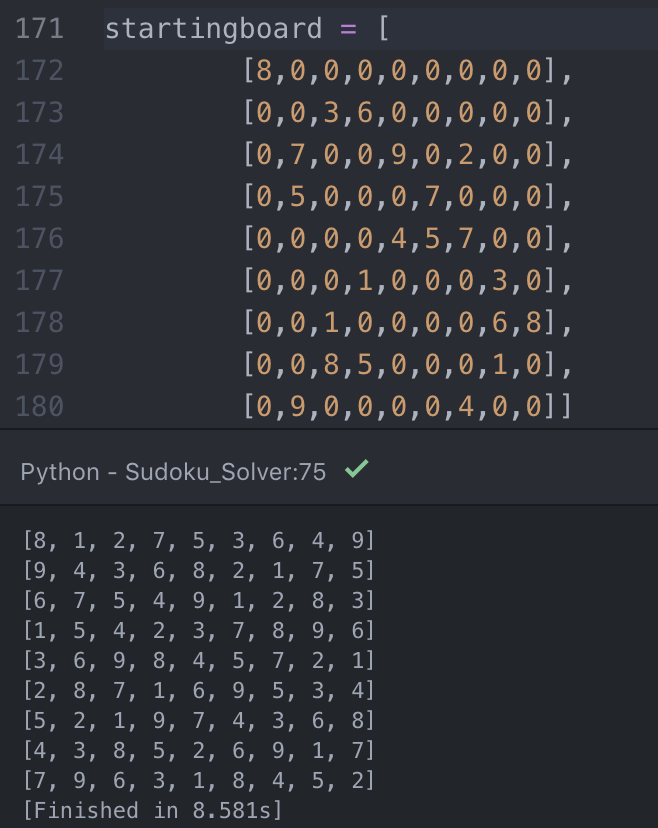
Another potential application of this algorithm is sudoku, which is perfect seeing as it has only one valid answer. If there were more potential
answers, then the algorithm would only return the first solution found. This involved a more difficult checking process because the cells that
must be checked were did not follow as simple a pattern. One must determine where the sell falls within the inner square so it can check the rest
of those cells. Originally, the checking process tripped me up and returned invalid results, this became apparent when some of the boards were
randomly handed checked against solutions.
After I was confident, I had to find the most difficult puzzle out there.
The puzzle, by Arto Inkala, rated an 11/5
for difficulty by
the telegraph. While
the solution took much longer than any other puzzle, it was correct! I plan to create a GUI so anyone can play. The code for both the N-Queen
and original Sudoku solution are available at my GitHub.
One of the first projects I tackled with my study team at Fuqua was largely self-directed; we were challenged to develop any data science
project on a topic of interest. This vague mandate allowed us to go in nearly any direction, as long as we could justify our direction and
provide valuable insight. We decided to pull an available data set about drug use from the
UCI machine learning repositoryto analyze drug use.
Luckily for us, most of the data was already cleaned. Some subjects were removed because they claimed to have used a fake drug, so the rest
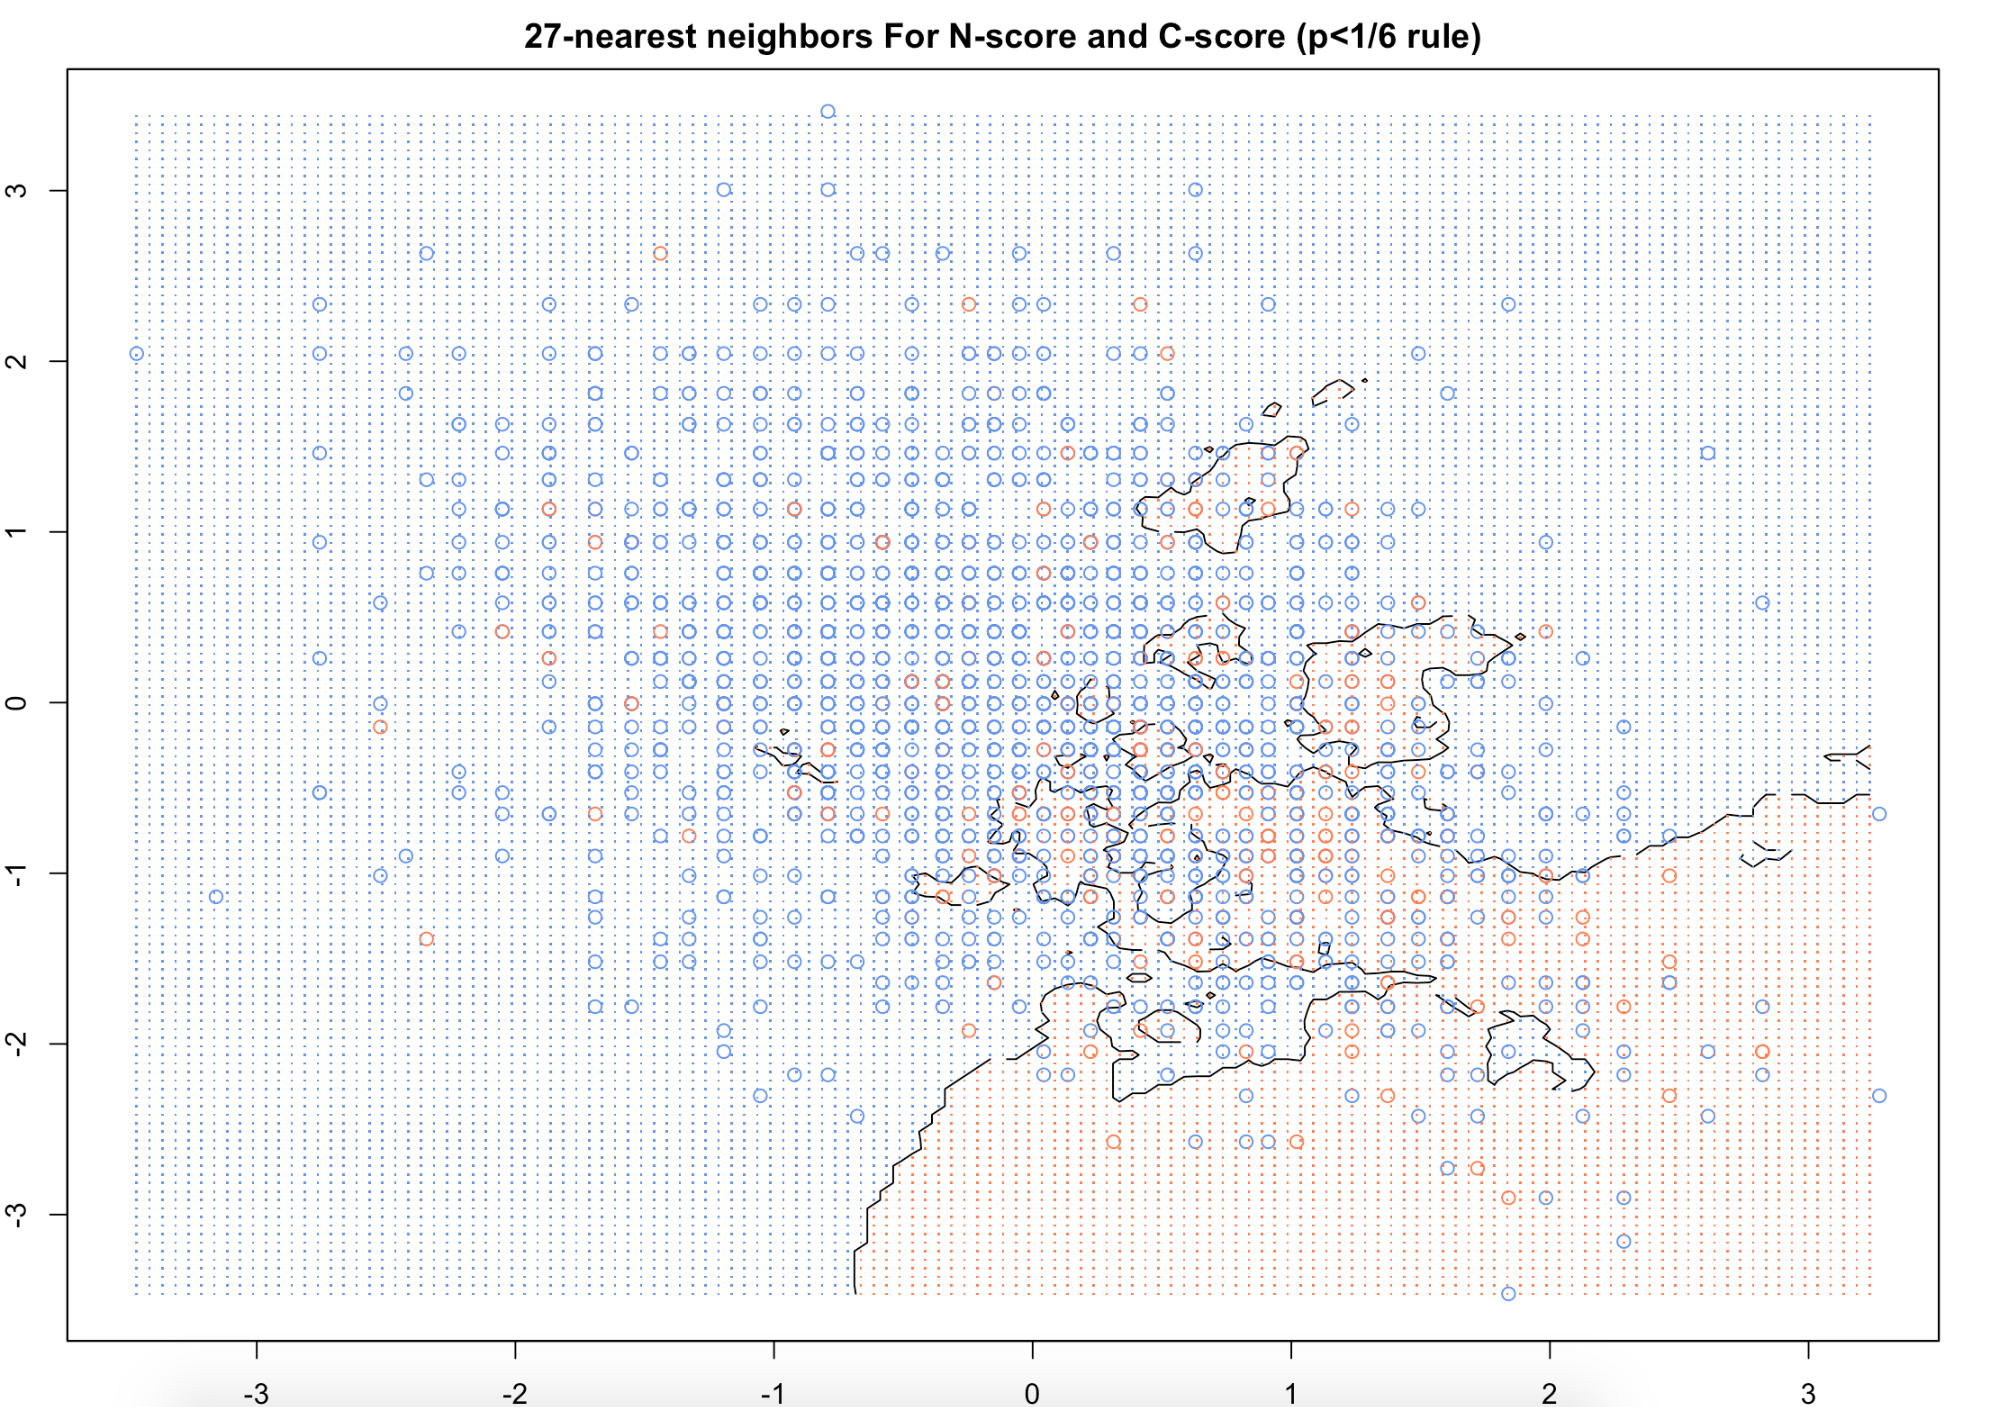
of their responses could not be trusted. For our preliminary analysis we implemented unsupervised clustering using the normalized personality
test results, to see how trait results related to one another. Additionally, we could see if any cluster would be valuable when modeling for
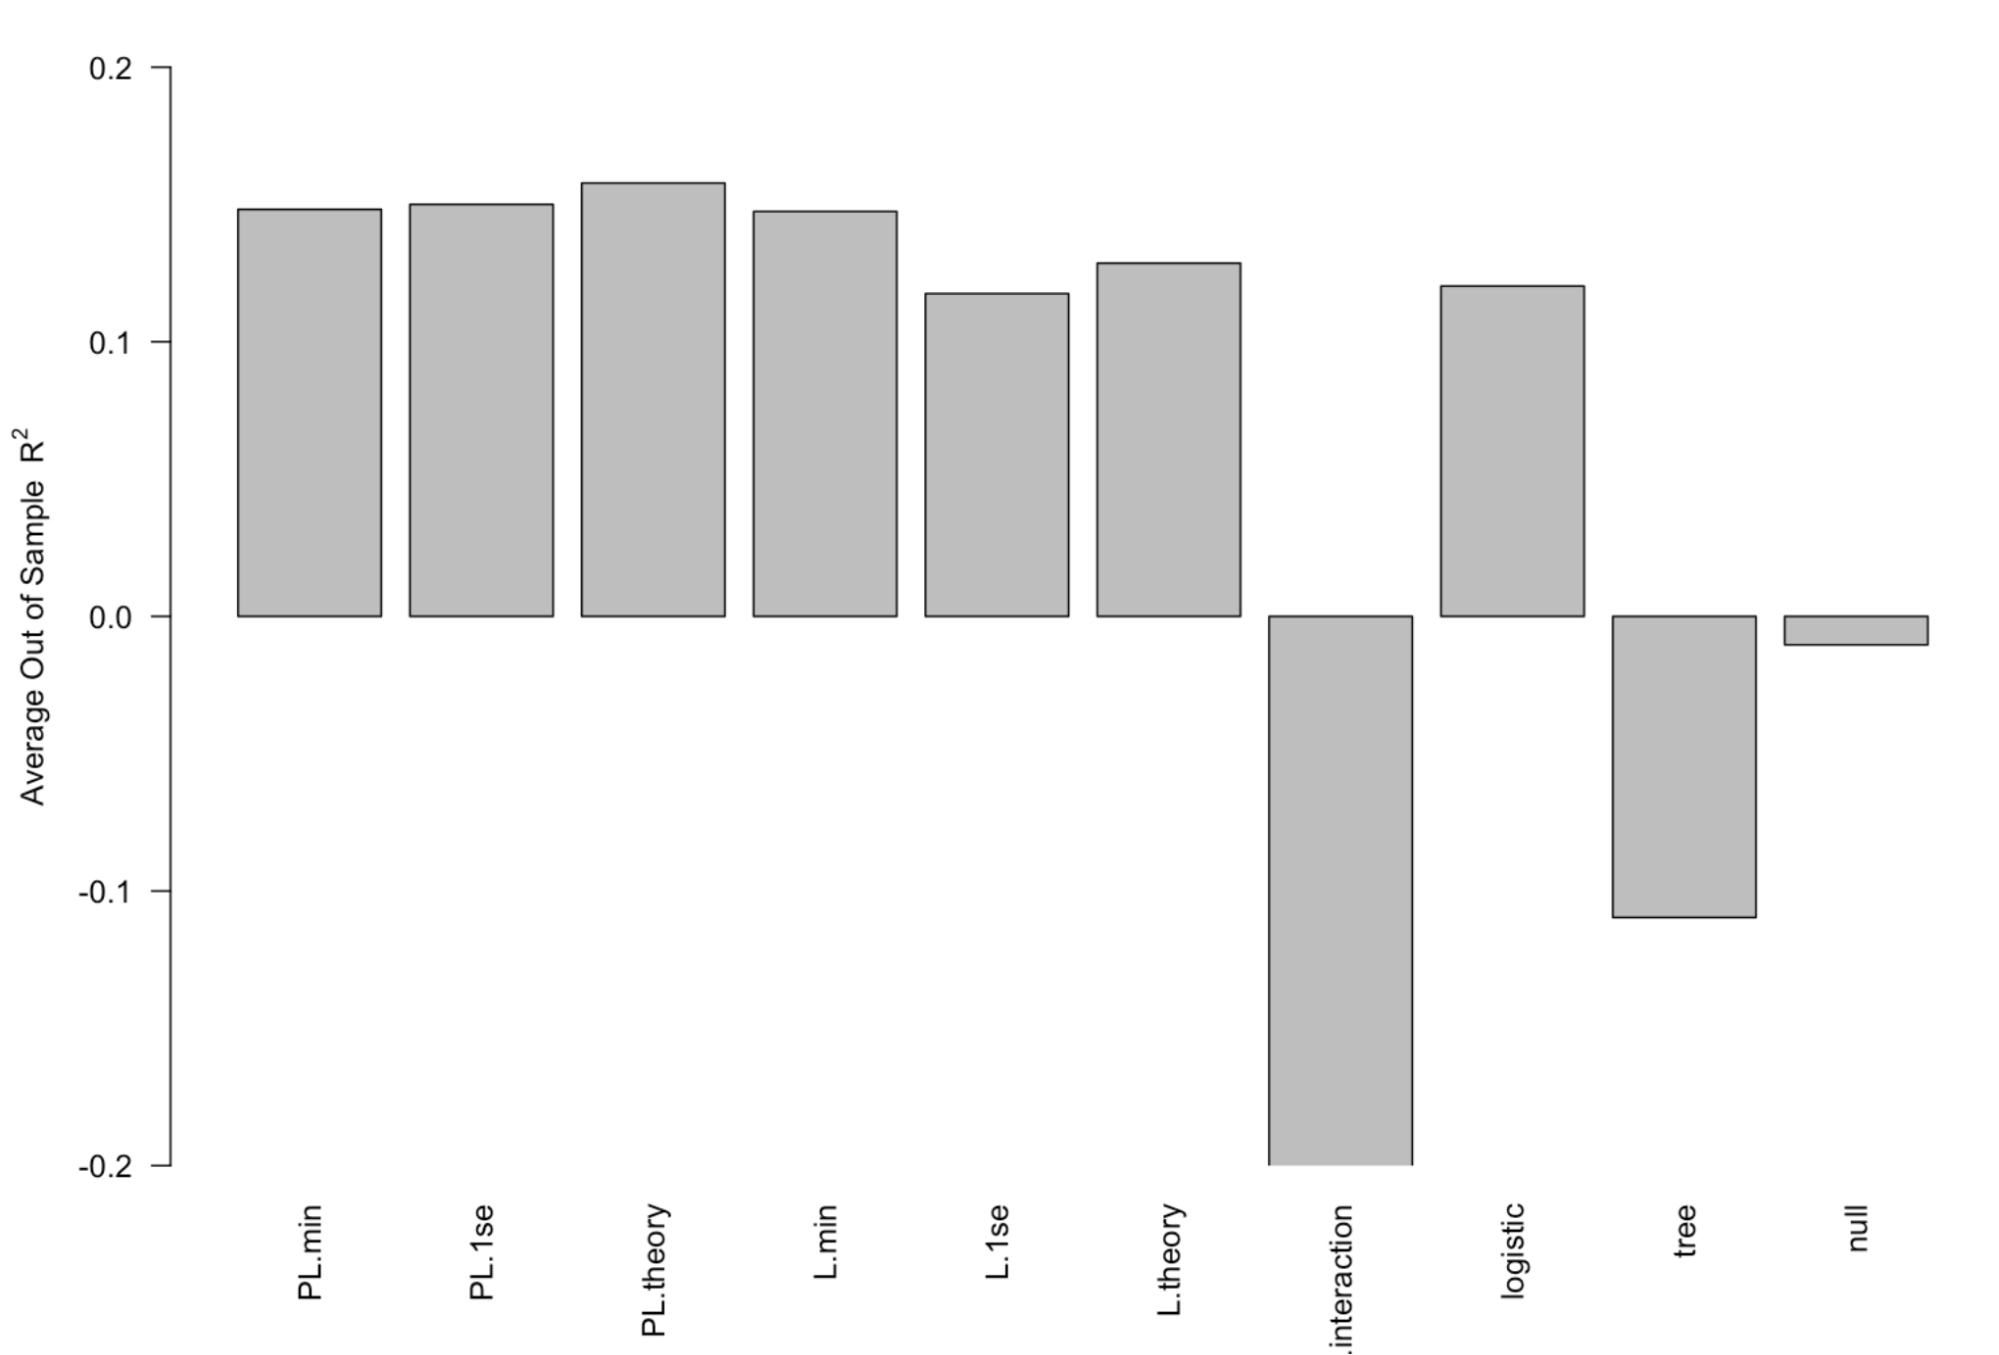
drug use later. We used a plethora of modeling techniques to approach the prediction issue, including logistic regression, lasso logistic
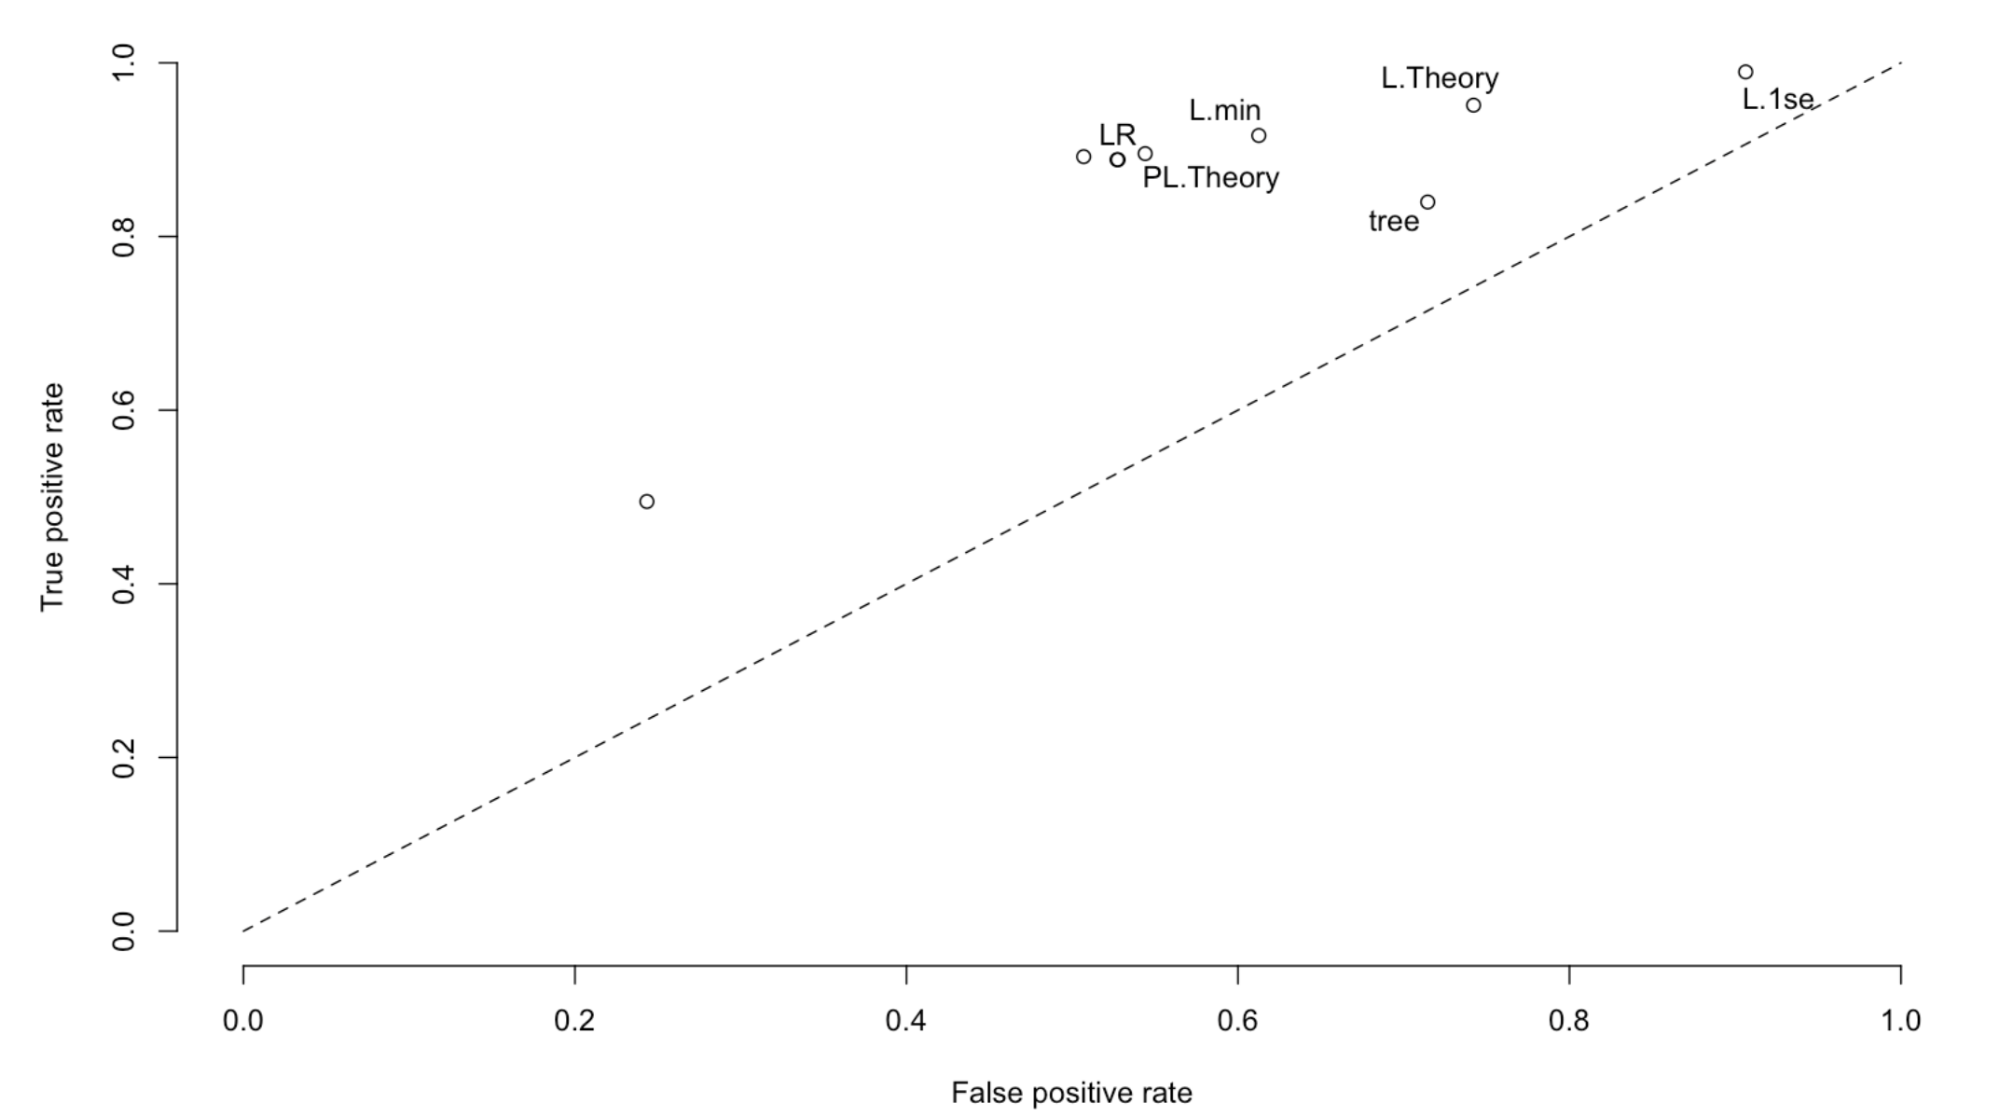
regression, post-lasso logistic regression, search tree, random forest, and support vector modeling.
The difference between performance was minimal after testing all methods using bootstrapping out of sample comparison. The increased level of
interpretability led us to believe the simple logistic regression would be the easiest to implement and convince our target audience to use.
I have long been interested in websites and the possibility of making my own. Accordingly, in my spare time, I worked through a course on Udemy.com. After learning about HTML, CSS, Javascript, JQuery and MongoDB among other technologies, I decided to undertake the task of creating my own website. Please browse around the website and let me know of any potential issues; I’m always looking for ways to improve! In addition to knowing how to create a website from scratch, this endeavor also helped me understand web scraping more thoroughly and grasp it quickly.